Loup County Public Schools vs Rolla
NE · 88 students • KS · 108 students • fiscal year 2024 • swap sides
In one line
- Loup County Public Schools spends 23% more per student than Rolla after adjusting for local price levels.
- Loup County Public Schools directs 6 more cents of every operating dollar to instruction than Rolla.
- Loup County Public Schools is far more dependent on local property taxes (72% of revenue vs 37%), which ties its budget more tightly to local property values.
Are these even comparable?
Establish the shape of each district before reading a single dollar figure.
| Loup County Public Schools | Rolla | |
|---|---|---|
| Students enrolled | 88 | 108 |
| Schools | 2 | 2 |
| Grades served | PK–12 | PK–12 |
| Setting | Rural | Rural |
| County | Loup County | Morton County |
| State | NE | KS |
| Local price level (US = 100) BEA Regional Price Parity. Above 100 means a dollar buys less here than the national average. | 90.1 | 90.1 |
The headline dollar
Current operating spending per student, shown three ways. The first is what each district reports. The second and third are the honest ones for comparison.
| Loup County Public Schools | Rolla | |
|---|---|---|
| Per student, as reported | $32,213 | $26,109 |
| Per student, price-adjusted Divided by the local price level, so both figures are in the same money. | $35,752 | $28,988 |
| Per student, price-adjusted, excluding transport Transportation provision varies enormously between districts and states. Removing it compares the parts both districts actually do. | $34,218 | $28,119 |
| Capital spending per student Buildings and land, reported separately and never folded into the operating figures above. It is lumpy: a district mid-build looks expensive for two years. | Locked | Locked |
Loup County Public Schools
Rolla
Where the money comes from
The funding mix determines how exposed a district is to local property values, to state politics, and to federal programmes ending.
Loup County Public Schools
- Local 71.6% Locked
- State 21.6% Locked
- Federal 6.8% Locked
Rolla
- Local 36.5% Locked
- State 55.6% Locked
- Federal 7.9% Locked
| Loup County Public Schools | Rolla | |
|---|---|---|
| Local share of revenue Mostly property tax. A high share means school budgets track local property values, up and down. | 71.6% | 36.5% |
| State share of revenue | 21.6% | 55.6% |
| Federal share of revenue | 6.8% | 7.9% |
| Total revenue | Locked | Locked |
How NE funds its districts
We have not yet written up NE's funding formula, so nothing is claimed here.
How KS funds its districts
We have not yet written up KS's funding formula, so nothing is claimed here.
Where the money goes
The same slices in the same order for both districts, plus the differences by function — because two pie charts side by side hide exactly the thing you want to see.
Loup County Public Schools
- Instruction 56.7% Locked
- Instructional staff support 3.5% Locked
- Student support 2.4% Locked
- Operations & maintenance 9.6% Locked
- Transportation 4.3% Locked
- Food service 3.2% Locked
- School administration 5.0% Locked
- District administration 3.9% Locked
- Other support 11.4% Locked
- Other current 3.2% Locked
Rolla
- Instruction 53.5% Locked
- Instructional staff support 0.2% Locked
- Student support 0.9% Locked
- Operations & maintenance 22.1% Locked
- Transportation 3.0% Locked
- Food service 3.7% Locked
- School administration 2.4% Locked
- District administration 9.0% Locked
- Other support 1.5% Locked
- Other current 4.2% Locked
What is actually different
Share of each district's operating dollar, Loup County Public Schools minus Rolla. Two pie charts side by side are almost impossible to read against each other; this is the same data as one chart.
| Loup County Public Schools | Rolla | |
|---|---|---|
| Cents of each operating dollar reaching classrooms Instruction plus instructional staff support, as a share of current spending. | 60.2% | 53.8% |
| Administration share District office plus school administration. | 8.9% | 11.4% |
| Transportation share | 4.3% | 3.0% |
What the money buys
Staffing levels are the most direct thing a budget converts into.
| Loup County Public Schools | Rolla | |
|---|---|---|
| Students per teacher This is a staffing ratio: total enrolment divided by teaching staff. It is NOT average class size, which no national source collects. Actual classes are larger than this number in every district. | 6.3 | 7.7 |
| Students per counsellor | Locked | Locked |
| Students per administrator | Locked | Locked |
| Total salaries All staff, not teachers alone. The federal survey does not separate teacher pay. | Locked | Locked |
Who they serve
The answer to "but they serve different kids" — which is usually a fair objection.
| Loup County Public Schools | Rolla | |
|---|---|---|
| Child poverty rate Census SAIPE estimate of children aged 5–17 in poverty within the district boundary. Used instead of free-lunch eligibility, which community eligibility has made unusable for comparison. | 21.7% | 22.3% |
| English learners | 0 | 0 |
| Students with disabilities | 0 | 0 |
| Enrolment change, 5 years | +18.9% | -6.9% |
Results, and results for the money
Stability and risk
The homebuyer’s real question: what is likely to change after I move in?
Loup County Public Schools
No stability flags raised.
Rolla
- Declining enrollment Enrolment fell more than 5% over five years. Enrolment decline is the single best predictor of school closures and programme cuts.
- Low share reaching classrooms Under 55% of current spending reaches instruction and instructional support, low against national practice.
| Loup County Public Schools | Rolla | |
|---|---|---|
| Enrolment change, 5 years | +18.9% | -6.9% |
| Long-term debt per student | Locked | Locked |
| Debt service share of spending | Locked | Locked |
Enrolling a child
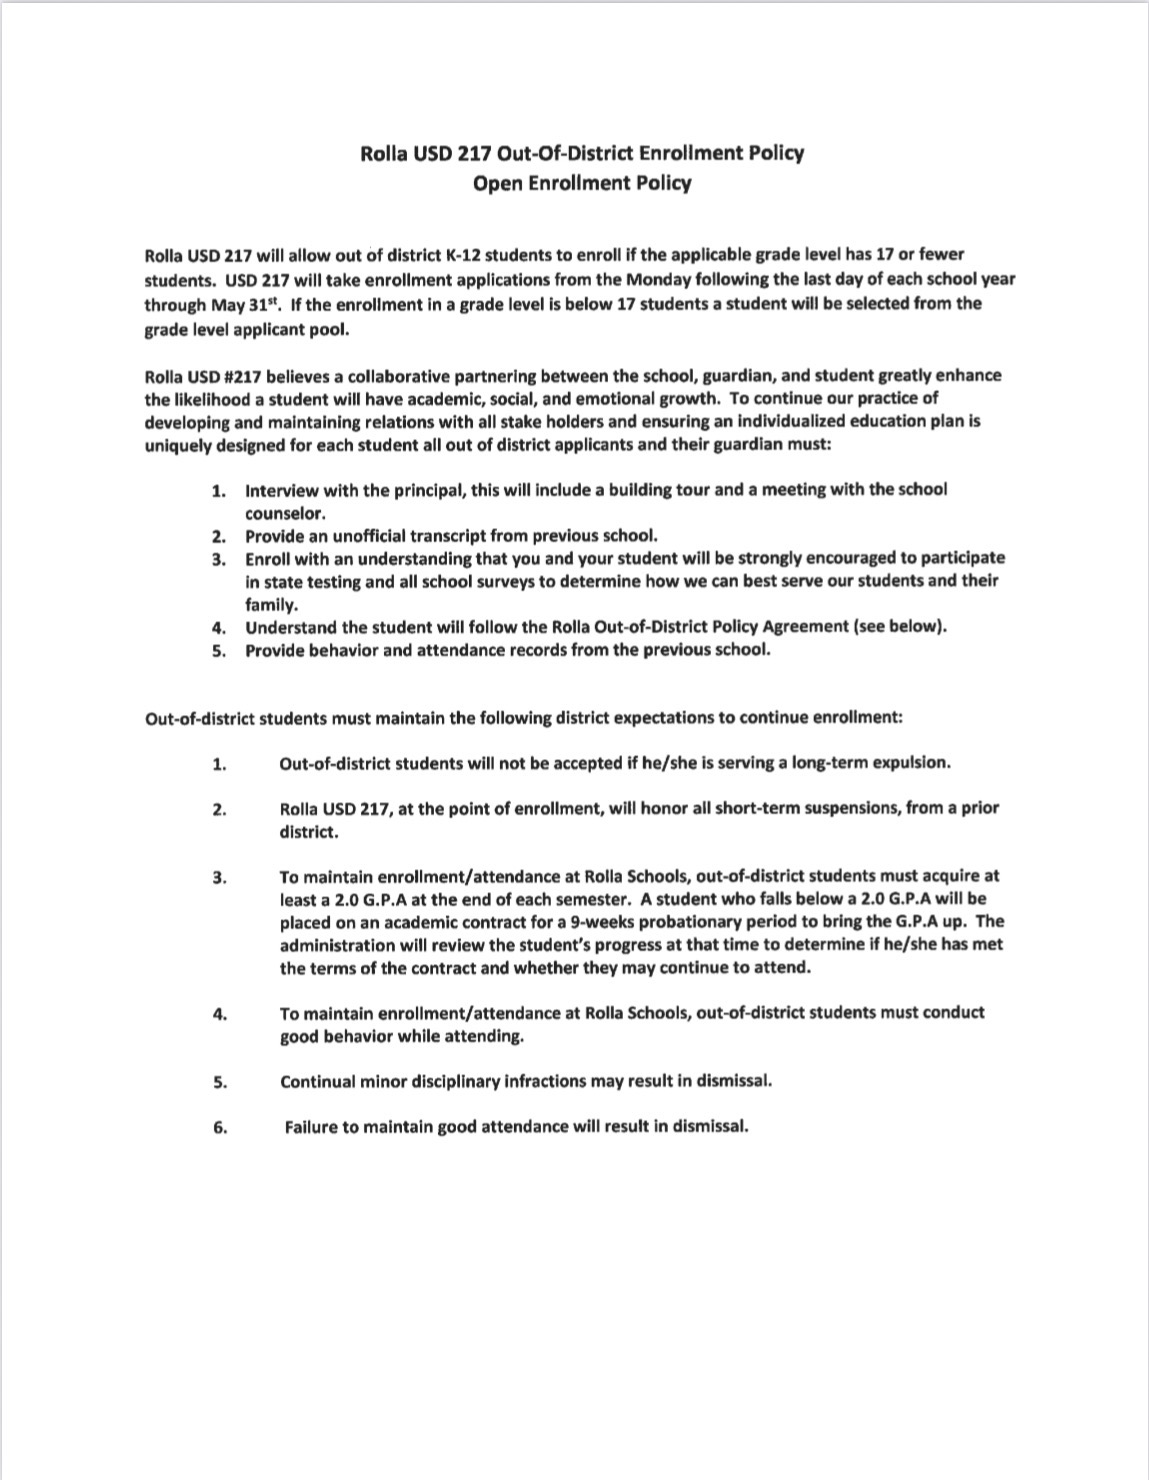
Is a seat at your zoned school guaranteed?
Loup County Public Schools
We have no such statement from this district — which is not the same as a promise that your zoned school has room. Most districts never publish the policy in either direction, and we have read only a fraction of the ones that do. Ask the school office directly whether your address’s school is enrolling at your child’s grade level before you sign anything.
Rolla
We have no such statement from this district — which is not the same as a promise that your zoned school has room. Most districts never publish the policy in either direction, and we have read only a fraction of the ones that do. Ask the school office directly whether your address’s school is enrolling at your child’s grade level before you sign anything.
- This is the district’s own published wording, not our summary of it. Policies are rewritten between enrolment seasons and a page can be out of date the day after we read it — the school office is the only authority on whether a particular grade at a particular school is full right now.
- A warning here is about capacity, not about your address. It does not mean your child will be moved; it means the district has told you in writing that it may move them.
Comparability notes
- Cross-state comparison. Dollars below are shown both as reported and adjusted to a common price level, because a dollar buys different amounts of teacher in NE and KS.
- At least one district sits outside a metro area with its own published price index, so its cost adjustment uses the statewide index. That is a coarser adjustment.
What these numbers are, exactly
- Finance: US Census Bureau Annual Survey of School System Finances (F-33), fiscal year 2024.
- Enrolment, staffing and directory: NCES Common Core of Data via the Urban Institute Education Data Portal, 2024.
- Child poverty: Census SAIPE school-district estimates, 2024.
- Price levels: BEA Regional Price Parities, 2024.
- Districts self-report to the F-33 survey. States differ in what they count as an operating expense, and several pay teacher pensions centrally so that cost never appears in a district’s books. No arithmetic fixes that; we name it instead.
- Property tax basis and borrowing: the same F-33 filing, revenue codes T06 and T02 and the long-term debt schedule (_19H, _21F, _31F, _41F).
Who decides, and what it costs you
Every band above this one asks what a district spends. This one asks who chose to.
Loup County Public Schools
The district levies its own school tax
This district raises property tax in its own name. Who sets the rate varies by state — an elected board in some, a public vote in others — but the levy is the school system’s own, and it is the part of a tax bill that school politics moves most directly.
Rolla
The district levies its own school tax
This district raises property tax in its own name. Who sets the rate varies by state — an elected board in some, a public vote in others — but the levy is the school system’s own, and it is the part of a tax bill that school politics moves most directly.
| Loup County Public Schools | Rolla | |
|---|---|---|
| School property tax levied, per student Only for districts that levy in their own name. Blank where the county or town levies instead — see the cards above, and read the next row. | $23,258 | $7,478 |
| Appropriated by the county or town, per student What the parent government handed the schools, for dependent systems. This is a general appropriation, not solely property tax. | — | — |
| Property tax as a share of all revenue How much of the budget rides on local property values, and therefore on local votes. | 64.0% | 25.1% |
| Long-term debt already owed, per student The balance at the end of the year, for scale. Repaid over decades, so it is a commitment made by earlier boards rather than a bill arriving now. | Locked | Locked |
| Debt service as a share of spending Interest plus principal repaid this year, against total spending. This is the part of the debt that is being paid now, out of money that would otherwise reach a classroom. | Locked | Locked |
| New long-term debt issued, per student Money borrowed during fiscal year 2024, as reported to the federal survey. What this figure does and does not tell you is set out under the table. | $0 | $0 |
- Loup County Public Schools: issued no new long-term debt in fiscal year 2024. That is a reported zero, not a gap in the data.
- Rolla: issued no new long-term debt in fiscal year 2024. That is a reported zero, not a gap in the data.
- A figure in the borrowing row is not a bond voters approved. The federal survey records debt issued, and that includes refinancing existing debt at a new rate — which changes nothing about what a district owes — as well as certificates of participation and lease-revenue debt, which in many states a board can issue with no referendum at all. To find out what was actually on a ballot, check the county election office.
- Debt is repaid over decades. A large balance per student is a commitment made by earlier boards and earlier voters, not a bill arriving this year. The debt service row above it is the part being paid now.
What this band does not answer yet
Unlock the full comparison of Loup County Public Schools and Rolla
The verdict, the headline dollar, the funding shares, who is served and every comparability caveat are free above, and stay free. What is behind the lock is the detail you would want before acting on any of it:
- capital spending per student
- total revenue and the funding mix in dollars
- the ten-line per-student breakdown of where the money goes
- counsellor and administrator ratios, and the total salary bill
- the debt behind the risk flags — per student, and as a share of spending
$19 once for this pair, or $7 a month for every district in the country.
One payment, no account to create. Buy on the web and the iPhone app unlocks with the same receipt.